Testing
The testing process for the RC car will involve a drop test, a drag race, and a deflection test using the Instron machine. The drop test will measure ensure the adhesive used will hold up and if the clearance is enough during the 2ft drop, the drag race will measure the velocity, and on the Instron machine it will be a good representation of the deflection due to a three-point load. During the drop test, the deflection of the chassis will be monitored to ensure it meets requirement 1d-16 which states that the clearance is enough to not hit the ground during the drop and requirement 1d-12 which states that the adhesive will also not fail during the drop test. During the testing, a recording was taken and then reviewed so that the maximum deflection point can be tabulated. Then it was possible to calculate the total deflection based on the difference between the initial measurement taken at rest and the measurement taken from the recording taken. The velocity will be tested by having the RC race down a track multiple times and taking the average. The procedure for this test was pretty basic in that each trial the RC would start from rest and then accelerate for 5ft. After the 5ft mark, the time keeper started the timer and would stop when the RC reached the 45ft mark. Lastly, a deflection test will be performed on the chassis to ensure that the component will not break at the location where the adhesive was applied, and if requirement 1d-13 was met which states that the chassis will not deflect more than .1in. Once the device was set in place, the point load was lowered down just barely touching the chassis. Then the loading was set to 40lbf and once the start button was pressed, the chassis was loaded and the Instron recorded the data. Then the data was exported and opened in excel.
One of the biggest testing issues that was experienced was during the velocity test. With the previously used brushed motor at 2400kv. It was noticed to overheat quite easily after some time of driving the RC. This was especially noticed during the 5 trials that were performed. The first trial, the maximum velocity was about 3.4mph and when the overheating began, the velocity dropped to 1.2mph. It was also necessary to take breaks in between each trial to let the motor cool down but this was not enough. After the new 1980kv brushless motor was used, this greatly increased the velocity from 3.4mph to 15.6mph. It was also not necessary to take the breaks after each trial since the new motor was not overheating. With a lower kv rating, the maximum velocity calculated was lower if the same gear ratio was used of 12:1. With the 2400kv motor the velocity was calculated to be 30mph but with the new 1980kv motor, the calculated velocity was now 25mph.
Testing 1: Drop Test
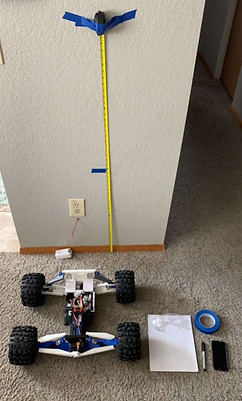
Figure 36. Image of the equipment used during the testing

Figure 37. Chassis at rest with no external loadings
Figure 38. Video where one trial out of the twelve was performed
In figure 33, the image has all of the equipment that will be needed. This includes a measuring device, writing utensil, paper, camera (phone), RC Car and a wall where the testing will take place. In the image in figure 34, this is the initial measurement that was taken and later used to calculate the total deflection since the chassis at this point was simply at rest. During the testing, a recording was taken and then reviewed so that the maximum deflection point can be tabulated. Then it was possible to calculate the total deflection based on the difference between the initial measurement taken at rest and the measurement taken from the video which can be seen in figure 34. It was noticed that the bottom of the chassis would sometimes hit the ground, but other times it would be find and so the number of trials was increased to get a better spread of data points as well as increasing the clearance between the ground and chassis. The predicted result was based on a deflection assuming the load was constant and simply supported. During the testing the actual gathered data was much larger than the predicted value but this was mitigated by implementing another equation and using the conservation of energy concept. By doing so, the predicted value was now much closer to what was actually occurring during the testing.
Testing 2: Velocity Test

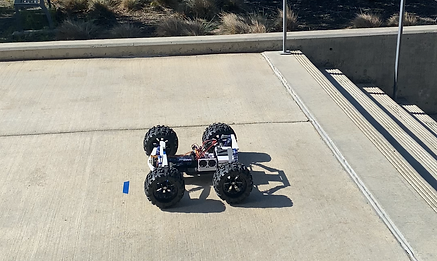
Figure 40. Image of second Velocity test w/ 1980kV motor
Figure 39. Image of the equipment used during the velocity test w/ 2400kV motor
Figure 41. Video where the first trial of the Velocity test can be seen
Figure 35 is showing all of the equipment used during the velocity test that was performed to determine the maximum velocity as well as the acceleration to then determine the length required to achieve the desired velocity. The general procedure for this test was pretty basic in that each trial the RC would start from rest and then accelerate for 5ft. After the 5ft mark, the time keeper started the timer and would stop when the RC reached the 45ft mark. This was done a total of five times with a 2400kv brushed motor. One of the major issues here was that the brushed motor could not handle the amount of current and the torque required to move the vehicle and so the motor would overheat. Once the overheating started, the velocity was noticed to drop. One good example can be seen in the first and last trials (see figure 7) where the maximum velocity experienced was 3.4mph and as the overheating began, the velocity dropped to 1.2mph for the last trial. To mitigate the issue, the motor was switched from a 2400kv brushed motor to a 1980kv brushless motor (see figure 8). With this change, the low end torque issue was solved and the maximum velocity that was experienced now was 13.2mph with the same distance traveled, meaning the acceleration had increased and no issues with overheating were experienced. The distance required to achieve a velocity of 30mph was calculated to be 147ft but the distance available during testing was only 40ft.
Testing 3: Deflection Test
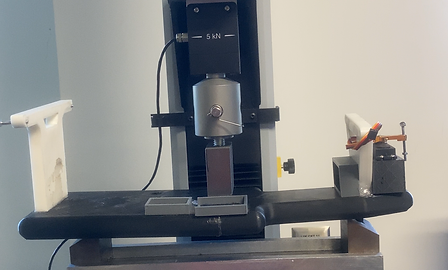
Figure 42. Chassis at maximum deflection
Figure 43. Video where the Chassis can be seen being loaded
In figure 38, the image shows the basic testing set up that was used as well as the chassis being loaded up to 40lb at the center where the adhesive was applied. Then, in figure 44, the recording is showing the load being applied and the deflection at the center of the chassis can be seen to increase with the loading. The testing procedure for this test was fairly easy and the most complicated portion was simply navigating the UI on the PC when logged in. Once the device was set in place, the point load was lowered down just barely touching the chassis. Then the loading was set to 40lbf and once the start button was pressed, the chassis was loaded and the Instron recorded the data. Then the data was exported and opened in excel. During the calculation for the deflection of the chassis, it was assumed that the percentage infill would be 100% which was not the case when it was printed. The actual percentage infill used was 25% which was noticeable in the calculations and the test results. With the deflection being calculated to be .0314in using 100% infill, and .126in by first multiplying the moment of inertia and the %infill then performing the calculations. The data that was tabulated showed that the maximum deflection was about .1049in which meant that the percentage error was about 16%. This difference can be due to the fact that holes were placed in the chassis but this was not taken into account when the deflection was calculated.