Analysis
There are countless forms of analysis that could possibly be done when in the process of designing. For the case of the RC Baja that is being constructed, analysis needed to be done in order to determine if the vehicle met the requirements proposed. Some of which include a the use of statics to find the forces acting on the vehicle and the deflection from the drop test. A stress analysis will also be used in order to determine if the chassis will be able to withstand the forces at an impact at the maximum velocity. Kinematics are used to find the axle rpm required to travel at a maximum velocity of 30mph and also then used to perform an analysis to determine the gear ratio and number of teeth for the gears. Mechanics of materials is used to determine the minimum thickness that is necessary to survive the impact from a 2ft drop. Analysis on the axles is also important to determine the amount of torque applied to the axles from the motor and an analysis to determine whether or not the axles are able to withstand the load from the various impacts.
-
Must have ONE Propulsion Motor
-
Must have ONE Propulsion Battery Pack on the vehicle
-
Battery must be a 7.2-Volt 6-cell RC battery, or any 7.4-Volt 2-cell or 2S LiPo RC battery
-
Gears teeth will survive the stresses caused
-
Motor must Transmit a minimum of 50 W
-
Keep cost at $500 or less
-
Vehicle can reach a velocity of 30 mph
-
Differential must weigh less than 1lbm
-
Chassis and drivetrain must withstand an impact at 30 mph
-
Chassis must not buckle due to force from a 30mph impact
-
Chassis must not exceed 3lbm (2.27kg)
-
Adhesive will not fail due to force at 2ft drop
-
The Chassis will deflect at most .1in due to the force at a 2ft drop
-
Chassis must have a minimum of 1.5” of clearance from the ground and not hit during 2ft drop
-
Chassis must allow the usage of fasteners no greater than M3 or M4 hex fittings
Requirements:

Figure 10. Gear ratio analysis
Analysis 1: Gear Ratio Analysis
The purpose of this analysis was to determine the axle rpm required for the vehicle to travel at a maximum velocity of 30mph and what the required train value is to achieve this velocity. Initially only the maximum rpm of the motor was given to be 234000rpm at 9.6v. In order to calculate what the maximum rpm would be for a 7.4v battery, the kv rating of the motor was calculated by dividing the maximum rpm by the voltage of 9.6v and resulted in a kv value of 2437.5. Then multiplying this value by the actual voltage for the RC of 7.4v gave a maximum rpm of 18037.5rpm. The maximum velocity of 30mph was converted to 31680 in/min, a unit that would end up canceling when calculating the axle rpm since that would require the circumference of the wheel in which is pi in radians and the diameter in inches. Solving for the axle rpm the equation of V= πD(RPMaxle) becomes RPMaxle=V/(πD) then plugging in and calculating results in an axle rpm of 1507.33rpm. The gear ratio can now be calculated by taking the maximum rpm of the motor running at 7.4v and the required rpm for a maximum velocity of 30mph. This would calculate out to be a train value of 11.97 then looking at table 8-7 in Mott, the maximum train value for a 20° full depth involute gear is 6.31. Then in order to satisfy this constraint, a double reduction drivetrain which can be seen in analysis 4.

Figure 11. Minimum Frontal Cross-sectional area
Analysis 2: Minimum Frontal Cross-sectional area
This analysis was performed to determine the dimensions for the front section of the chassis in order to survive an impact from a velocity of 30mph. The initial step taken was using kinematics to determine the acceleration based on an assumption that the vehicle would almost instantaneously stop so a time was assumed of 0.05s. Using the velocity of 30mph converted to .00833 miles/sec and the time of .05, gave an acceleration of .166miles/sec^2. Then using the equation for force of F=ma and a mass of 10lbs, the resultant force due to an impact at 30mph was calculated to be 272.2lbf. The area was then found based on the force and the ultimate tensile strength property and was calculated to be ..02979in^2. Taking the square of the are would then give the dimension for a square cross section which came out to be .173in. This dimension was the absolute minimum that the cross section could be but because of size restriction, a cross section of 1.5in x .875in was used. With these dimension the stress now became 207.39psi which was less than the ultimate tensile strength of 9137.38psi meaning that the front of the chassis will survive the impact.

Figure 12. Chassis force at drop and deflection

Figure 13. Chassis force at drop and deflection(Cont.)
Analysis 3: Chassis force at drop and deflection
The purpose for this analysis was to determine what the reaction at the wheels would be from the drop based on the maximum weight of the RC. An assumption was made that the width used was the track width of the vehicle. Using the conservation of energy principle, the velocity was calculated to be 135.76in/s. Then using kinematics and the velocity that was just calculated it is possible to find the acceleration which came out to be 383.97in/s^2. Now, having the mass and acceleration it is possible to calculate the force using the equation F=ma. Plugging in values, the force of the drop due to the weight of the vehicle was 160ft-lb/s^2 or the equivalent of 44.26N or 9.95lbf. Then this force is multiplied by the safety factor of four and used to calculate the deflection and the stress the adhesive would experience. The adhesive was expected to experience 8.312 psi but when the weight of the deice was measured to be 7lbf not 10lbf, the new stress calculated was 6.234psi and was well within the ultimate tensile strength of 1200psi for the adhesive.

Figure 14. Spur and Pinion Material Selection

Figure 15. Spur and Pinion Material Selection(Cont.)

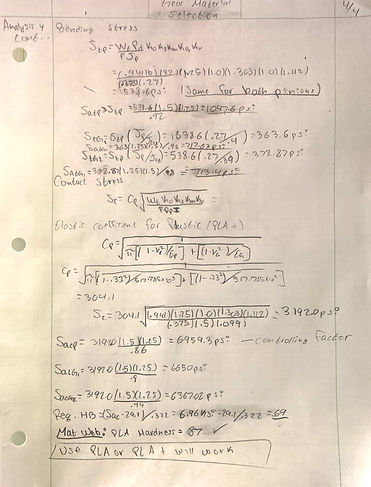
Analysis 4: Spur and Pinion Material Selection
The purpose of this analysis was to determine if the material that was chosen would be sufficient to withstand the various stresses like the bending or contact stress. Factoring was then used to calculate the number of teeth for the pinion and spur gear, some guessing had to be done until a set of gears closely matched the train value of 4:1 and 3:1 which were values determined through factoring. After some iterations, the number of teeth for the pinion gear was 16 and for the spur was 63 teeth, the bevel gears are 15 teeth and 45 teeth. This then made the process of calculating the diametral pitch and pitch diameters for each gear much easier. Then it was important to calculate the transmitted load which will later be used to calculate the bending stress on the gear teeth. The contact stress was also important, and so this was calculated by first determining the plastic coefficient for PLA + using the modulus of elasticity and it's Poisson's ratio. After this was calculated, it was possible to calculate the HB hardness required to withstand the various conditions and was determined to be a Brinell hardness of 69 while PLA had a hardness of 87. This gave the team confidence that the material used would hold up during operating conditions.
Figure 16. Spur and Pinion Material Selection(Cont.)
Figure 17. Spur and Pinion Material Selection(Cont.)

Figure 18. Bolt Diameter for motor mount
Analysis 5: Bolt Diameter for motor mount
The analysis in appendix A05 is focused on determining the minimum diameter bolt that will not fail for the motor mount to be fastened to the chassis. Making the assumption that the bolt was made of SAE grade 1 steel, the yield strength of 36ksi was used to calculate the diameter based on the maximum shear force from the weight of the vehicle. Then to calculate the diameter the formula for shear stress was rearranged to solve for the diameter. Plugging in the values that are known, the diameter is calculated to be .013298in. In order to be sure that these bolts would not fail, an analysis on an M4 bolt was done. Using the diameter of the M4 bolt, the area was calculated to be .0195 in^2 and using the shear stress from before of 5lbs. The new shear stress was calculated to be 256.702 psi. The yield strength of the material was rated at 36000 psi which meant that using the M4 bolts would be sufficient enough to not fail under load.

Analysis 6: Deflection and Stress caused by Suspension tower
Figure 19. Deflection and Stress caused by Suspension tower
This analysis is focused on determining what the reaction forces caused by the shock tower are and what the deflection is due to those forces. In appendix A06 it can be seen that the suspensions are set to be at a 45 angle which means the x and y components for these forces would be the same. Using a FBD, the reactions were calculated in order to determine the maximum shear and the maximum moment since these were values that needed to be determined in order to calculate the bending stress, the maximum shar force was determined to be 47.87lbs and the maximum moment was 30.16 lb-in. Then using the equation for normal stress due to bending. Calculating the moment of inertia to be .59326 in and using the moment of 30.16 lb-in and a c of .5625in which is the maximum distance from the neutral axis to the outermost fiber of the beam. The bending stress was then calculated to be 28.59 psi. Comparing this to the flexural strength of the material of 10732.8 psi, the chassis will be able to withstand the impact of the shocks. Lastly the deflection was calculated to be .00106in and was less than requirement 11 of less than .1in of deflection.

Analysis 7: Power transmitted by motor
Figure 20. Power transmitted by motor
The purpose of this analysis was to calculate the actual motor power based off of the estimated power calculated and then multiplied by motor efficiency. In appendix A07, initially the estimated motor power was first calculated by taking the input voltage of 7.4V and multiplying by the motors maximum current of 9.55 which was given by the specifications sheet. The estimated power was calculated to be 70.67W. Then the following step would be to calculate the motor's actual power by taking the maximum efficiency that it is rated at and multiplying by the estimated power. Taking the best estimated value that can be seen on the graph, a motor efficiency of .71 was assumed. The actual power was calculated to be 50.13W which makes sense because the estimated value was calculated based on the assumption that the motor efficiency was .1 or 100% efficient. In real world applications this would not be the case and so motor efficiency was needed to calculate the actual value from the estimated.

Figure 21. Rear Axle diameter and deflection

Figure 22. Rear Axle diameter and deflection(Cont.)
Analysis 8: Rear Axle diameter and deflection
In appendix A08 the analysis is focused on calculating the minimum axle diameter for the designed to withstand a shear stress of half of the materials yield strength of 241MPa. The torque was first calculated by taking the power of the motor and multiplying by the constant 9.5488 then dividing by the RPM of the axle. Plugging in values, the torque was calculated to be .151Nm. Then by rewriting the formula for torsional shear of τ=Tc/J into into J=Tc/τ the radius can be calculated by substituting J with πr^4/2 and assuming the material is aluminum 6061 –T6
evaluates to 9.274*10^−4 in. Then the radius was doubled to get the minimum diameter for the axle which was .00185in. Then an axle diameter of .175in was used to calculate if the axle deflection met requirement 11 in section d of the introduction which states that there must be less than .1in of deflection. The deflection was calculated to be 1.109in at a length of 8in and a diameter of .175 which definitely exceeded .1in of deflection. In order to solve this issue the diameter was doubled to .35in and the deflection was recalculated to be .0693in. This would mean that the rear axle must be .35in to have a deflection less than .1in and be able to withstand 120.5Mpa of shear.

Figure 23. Angular and Actual Velocity
Analysis 9: Angular and Actual Velocity
The analysis done in appendix A09 was done to determine what the actual velocity of the vehicle was going to be knowing the gear ratio that was determined. By taking the number of teeth on the spur and dividing by the number of teeth on the pinion, a train value of 11.956 was calculated. Then taking the motors maximum rpm of 18037.5rpm and dividing by the train value to calculate the axle rpm of 1508.59rpm. This was then multiplied by the circumference of the wheel and a velocity of 30.025mph was calculated. This met requirement 1.d.7 which states the RC can travel at 30mph. The angular velocity of the wheel was also calculated by multiplying the axle rpm by 2π and then dividing by 60, this resulted in an angular velocity of 157.98 rad/s.

Figure 24. Forces on Pinion
Analysis 10: Forces on Pinion
The forces acting on the pinion were calculated in the analysis performed in appendix A10. The pitch line speed of the teeth needed to be calculated in order to determine the tangential force. Plugging in the pitch diameter and the rpm of the motor into the pitch line speed equation, the pitch line speed was calculated to be 1710.41 ft/min. Then the tangential force was found by dividing the power of the motor by the pitch line speed and was calculated to be 1.30lbs. The radial force was found to be .472lbs by multiplying the tangential force by the tangent of the pressure angle and the normal force was found to be 1.381lbs by dividing the tangential force by the cosine of the pressure angle.

Figure 25. Chassis Critical Load
Analysis 11: Chassis Critical Load
This analysis was done in order to calculate the critical load of the chassis to determine if the force produced during the impact test will cause the chassis to buckle which can be seen in appendix A11. Here it was assumed that the width of the chassis was going to be the least dimension since that would be the location of failure so a width of 76.2mm was used and a thickness of 28.575mm for the cross section. It was determined that the chassis was a long column and so Euler’s formula was used. Taking the material to be PLA +, the modulus of elasticity was determined to be 2.1GPa and the critical load was calculated to be 12,490lbs. Then taking a look at the calculated value in analysis 2 (appendix A02) which was the force due to an impact at 30mph which was calculated to be 4382.4lbf and so that would mean that the chassis will not buckle due to an impact at 30mph. This meets requirement 1.d.10 which states that the chassis must not buckle during the impact at 30mph.

Figure 26. Pinion Setscrew Diameter
Analysis 12: Pinion Setscrew Diameter
The analysis performed in appendix A12 was done in order to determine what the minimum size set screw would be required to fasten the pinion gear and withstand the torque produced by the motor. The material of the set screw was assumed to an SAE Grade 1 Steel which meant it had a tensile strength of 60ksi. With a motor power of 50.13W and an rpm of 1507.33rpm, the torque was calculated to be .3176 N-m. Then using this value and plugging in to the equation d=√(4T/DπSu) the diameter came out to be .0221in or .562mm. Taking a look at standard sizes, a #0 set screw with a thread diameter of .060in will be sufficient to fasten the pinion to the motor shaft. This met requirement 1.d.14 which states that no greater than M4 fasteners will be used and since 4mm is .157in, the #0 set screw is within range.